The Timewave Explorer application is fully free and open source, and is built on a platform of my own creation called Noonian, also fully free and open source.
Unfortunately the documentation is pretty sparse, particularly for building and installing packages, and for setting up and collaborating on a project with source control (git). So if you want to mess around with the dev side of this Timewave Explorer, it’ll take a little hacking.
For this post, I’ll make available a simplified method for setting up a dev envionment for anyone who’d like to poke around and modify the source code.
Note, the following was done on a Debian Linux commandline. It should work pretty much the same on a Mac OS machine (there may be some wrinkles to deal with), but on a Windows machine there’s probably more wrinkles than its worth wrestling with. If you’re using windows and aren’t in the mood for those struggles, I’d suggest setting up a Debian virtual machine on VirtualBox and using that. (I’d also recommend switching to Linux entirely and getting the hell away from the Microsoft and Apple tech overlords! But that’s a discussion for another time.)
Here are the steps:
- Set up the Noonian stack (namely MongoDB, Node.js, and Noonian itself) according to these instructions.
- Stop at “Instance Setup” step, as I’m providing the instance directory in a zip file below.
- Before proceeding, make sure the mongo service is running, and node and noonian are available on the PATH:
-
echo show databases | mongo
node -v
noonian -h
-
- Grab this zip file which contains the fully configured instance, as well as a dump of the bootstrapped DB. Unzip to a directory on your hard drive, and change directory to make it your current working directory (all commands below should be executed from within this directory)
- Restore the database dump to mongo DB
-
mongorestore --db noonian-twz-dev mongodump/2021-03-03/
-
- Tell noonian about the instance and start it up
-
noonian add
noonian start
-
- Load it up in your browser; Log in to the back-end with username admin (password is admin)
- The timewave explorer application:
- http://127.0.0.1:6500/twz-dev/twz_browser.html
- The development back-end:
- http://127.0.0.1:6500/twz-dev/dbui2/index/
- The timewave explorer application:
To start your journey into the code, Go to Angular -> Applications and load up “twz_browser.html“.
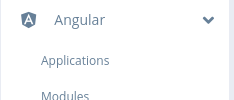
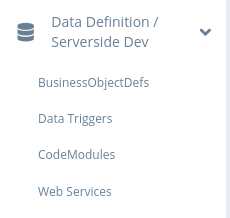
The Angular templates, controllers, directives and such that make up the web application are accessible via that same Angular submenu. Server-side components are accessible via the Data Definition / Serverside submenu, primarily the “Web Services” and “CodeModules”.
Hopefully that gets you started! Feel free to comment on this post with questions/problems.
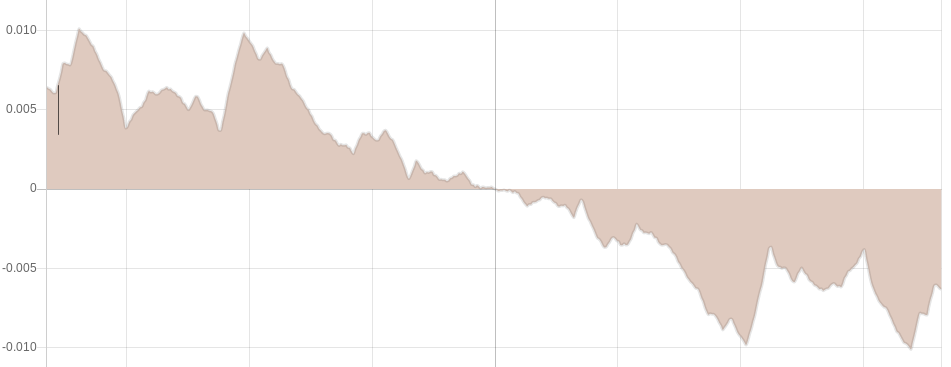
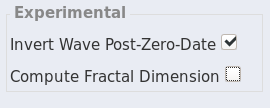 Since nothing much interesting happens when you scroll to the right of the zero date, and considering the fact that we are currently existing in the time after Terence McKenna’s original zero date designation, perhaps we should consider ideas for extending the wave past it.